Backend Benchmarking#
A simulation framework is only as compelling as the speedups it can demonstrate.
mcframework makes “how fast is each backend on my workload?” a first-class, repeatable
operation: run_suite() times the same Monte Carlo workload
across every available execution backend and returns a structured, plottable,
JSON-serializable report.
The idea: the backend matrix is data#
Each backend is described by a BackendSpec — a label, the
run() backend string, and a Torch device. default_backends()
assembles the device-aware default set: the CPU backends are always included, while the
Torch CPU, Apple-Silicon MPS, and NVIDIA CUDA backends are added only when their device
is actually available. A run therefore never advertises a backend it cannot execute.
Because the matrix is data rather than code, adding a new accelerator later (CUDA is the next milestone) is a single extra spec plus a device gate — not a new benchmark script.
The measurement core depends only on NumPy. Plotting lives in
plot_benchmarks(), which imports matplotlib lazily, so the
plotting dependency stays optional (pip install mcframework[viz]).
Quick start#
from mcframework import PiEstimationSimulation, run_suite, default_backends
from mcframework.benchmark import plot_benchmarks

sim = PiEstimationSimulation()
report = run_suite(sim, [1_000, 10_000, 100_000, 1_000_000], default_backends())

print(report.summary_table())   # execution-time + speedup table (N/A for gaps)
fig = plot_benchmarks(report)    # four-panel performance figure
data = report.to_dict()          # JSON-serializable artifact
run_suite warms up each backend once (to prime process pools, JIT, and caches), then
times the full sizes × specs grid. Each cell runs through
benchmark_run(), which calls sim.run(..., compute_stats=False)
so timings reflect pure sampling throughput, not statistics.
Reducing noise: best-of-N#
Wall-clock timings wobble with scheduler and GC noise. Pass repeats=N to run each cell
N times and keep the best (minimum) time — the standard denoiser for microbenchmarks:
report = run_suite(sim, [100_000, 1_000_000], default_backends(), repeats=5)
Note
Best-of-N captures throughput, not variance or per-operator cost. For kernel-level
detail (per-op timings, traces), reach for mcframework.profiling.
Keeping large runs fast: quick mode#
The sequential backend is O(n) and dominates wall time at large sizes. quick=True skips
the sequential backend above max_sequential_size so a big sweep stays fast while still
measuring the parallel and GPU backends at full scale:
report = run_suite(
    sim, [1_000, 100_000, 10_000_000], default_backends(),
    quick=True, max_sequential_size=1_000_000,
)
The summary table and speedups are N/A-aware: a backend missing a cell (skipped, or
failed because its device is unavailable) simply reads N/A instead of crashing the run.
The report#
A BenchmarkReport collects every measured
BenchmarkResult plus the system_info()
captured at run time. Useful methods:
Method |
Returns |
|---|---|
|
results grouped by backend, sorted by size |
|
|
|
fixed-width execution-time + speedup table |
|
fastest result at a given size (default: largest) |
|
JSON-serializable dict (system info, sizes, rows) |
Command line#
The library ships a console entry point — the demo
(demos/demo_backend_benchmark.py) is just a thin wrapper over it:
# Quick headless run that saves a figure and a JSON artifact:
mcframework-benchmark --quick --save backend_benchmark.png --json report.json --no-show

# Custom sizes, more repeats, exclude MPS:
mcframework-benchmark --sizes 1000,10000,100000 --repeats 5 --no-mps
Key flags: --quick, --sizes, --repeats, --max-sequential-size, --no-mps,
--save PATH, --json PATH, --no-show.
The benchmark figure#
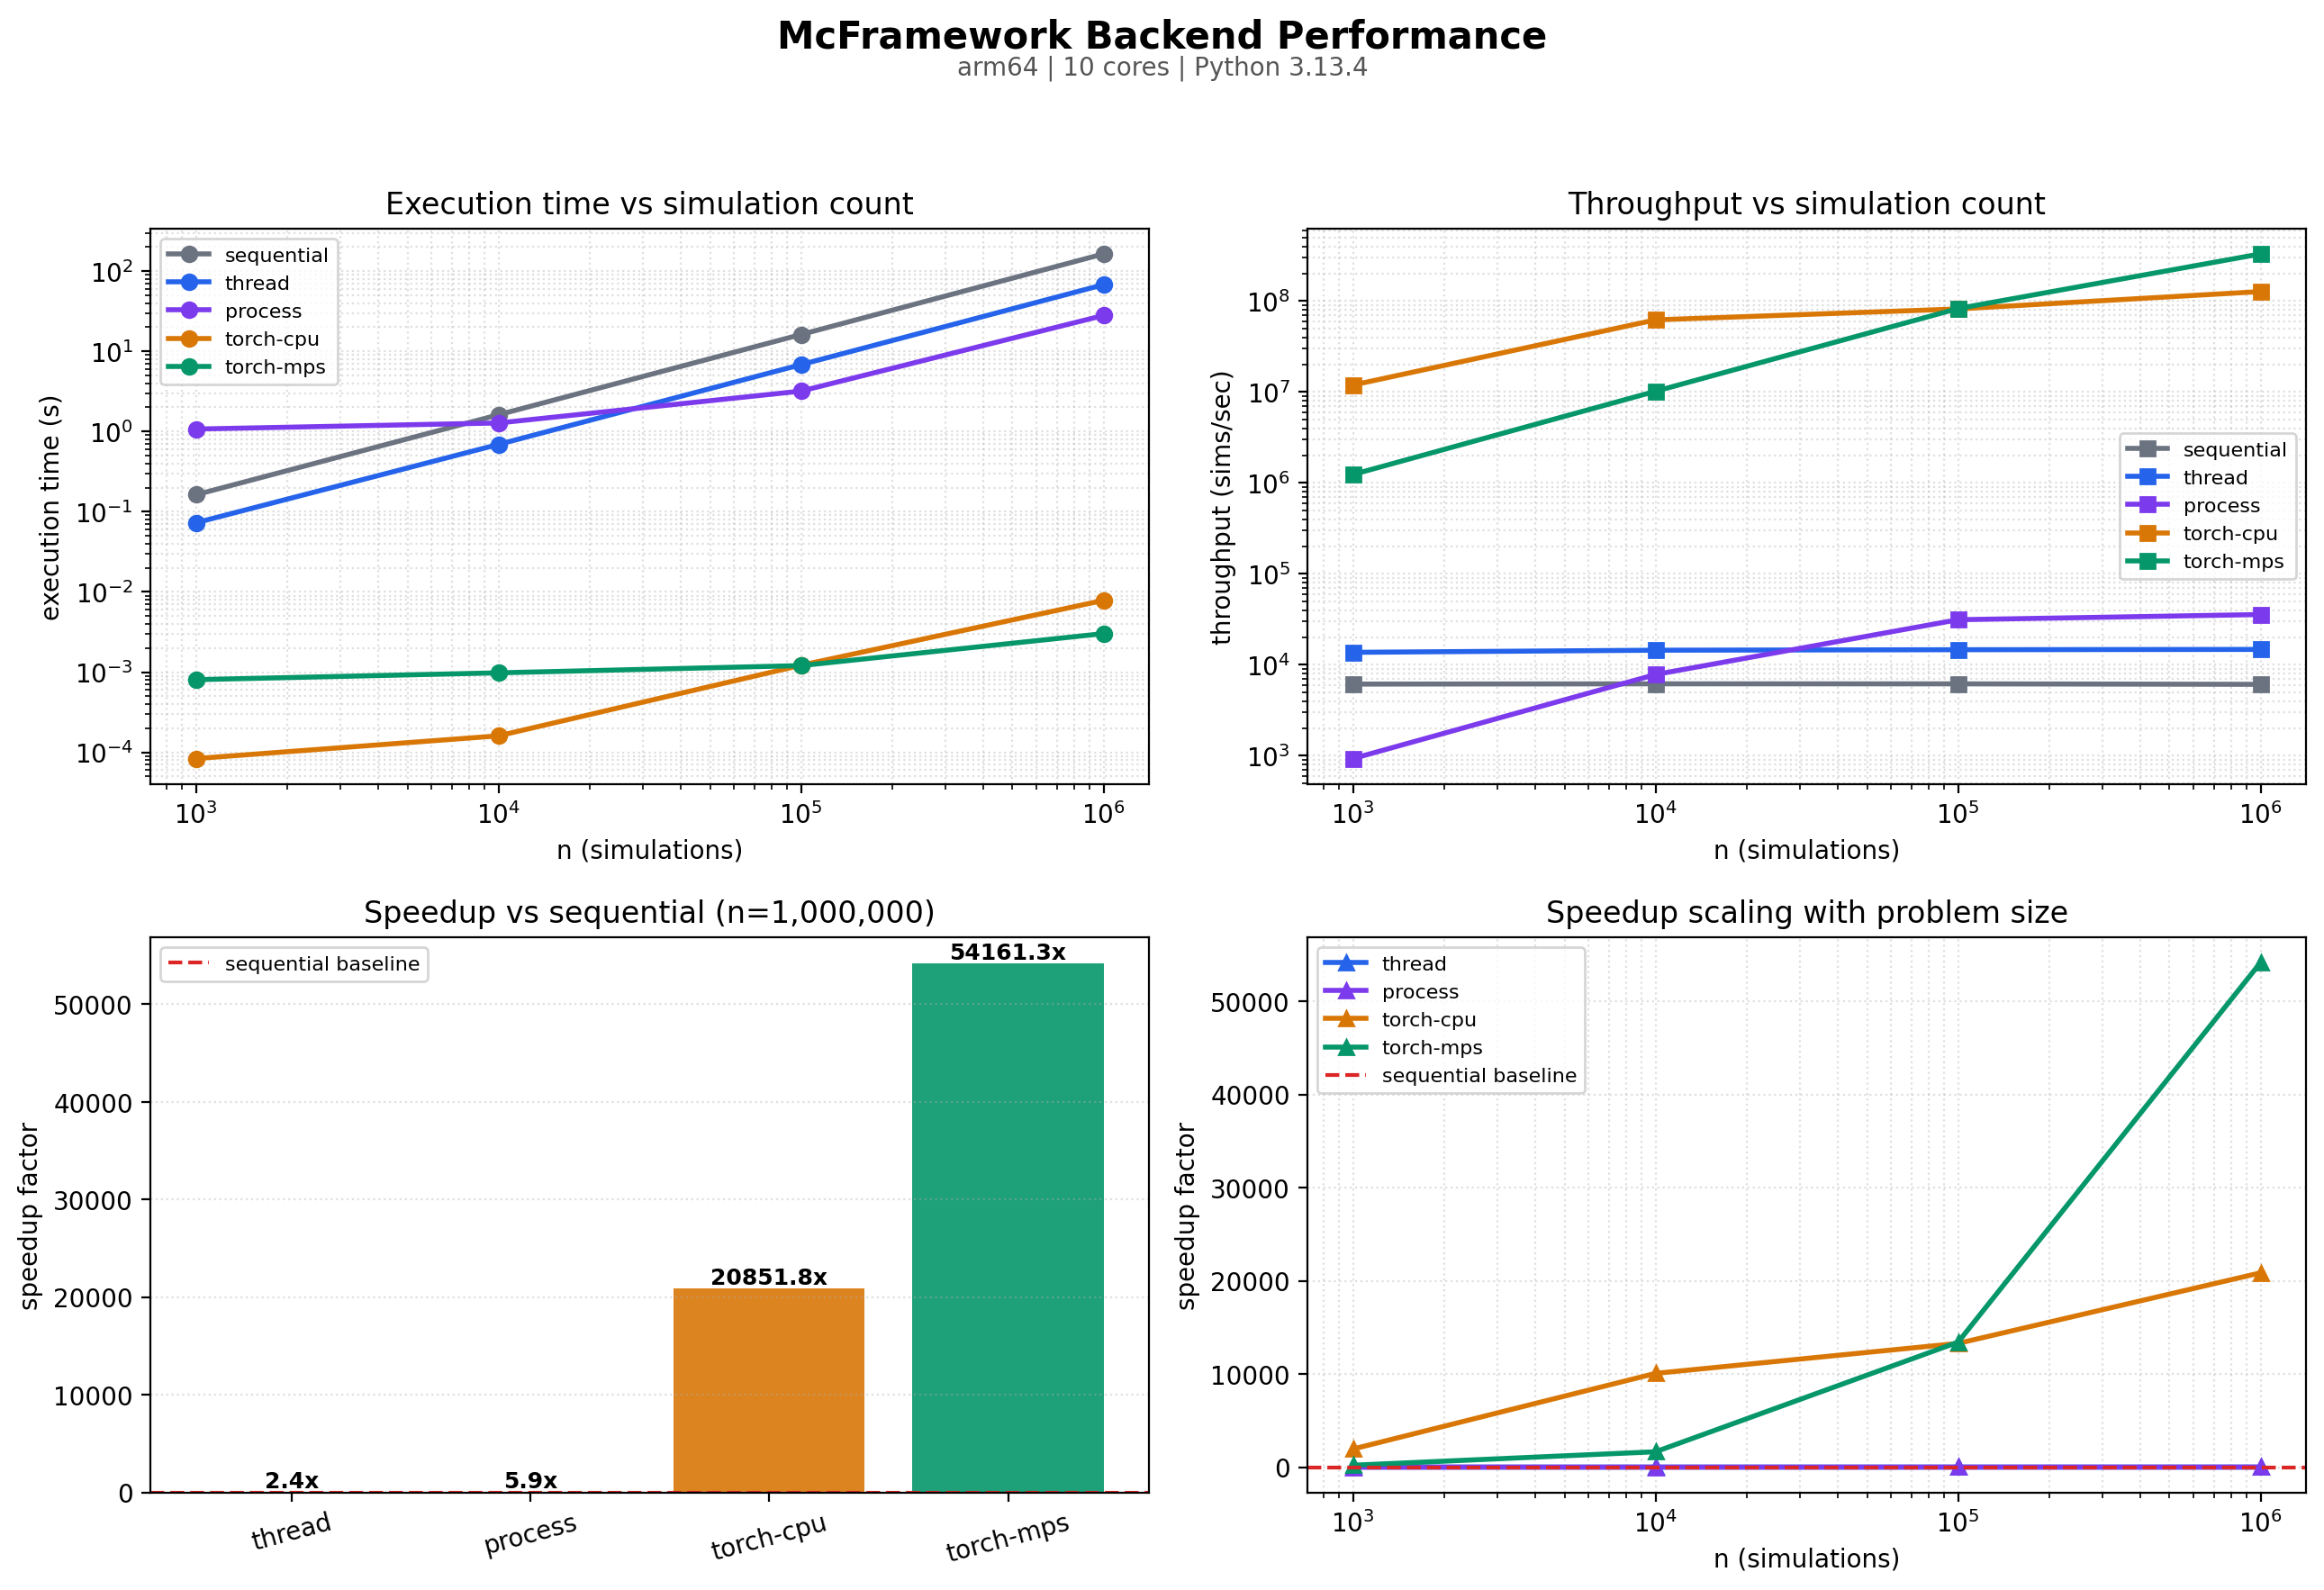
plot_benchmarks renders four panels in a clean, light aesthetic: execution time vs n
(log-log), throughput vs n (log-log), a speedup bar chart at the largest common size,
and speedup scaling with problem size against the sequential baseline.
MPLBACKEND=Agg python demos/demo_backend_benchmark.py --quick --save backend_benchmark.png
See also
Benchmark Module for the full API reference.